The Global
Information Hub for
Lighting Technologies
and Design
Figure 1: Semantic contours for chromaticity differences from the chromaticity center in the CIE x,y chromaticity diagram for a warm white chromaticity center, the Planckian radiator at 2500 K; x=0.4770; y=0.4137 (light green dot). Going off the center in any direction, contours indicate “good-very good” (green contour), “good” (yellow contour), “moderate-good” (orange contour), “low” (red contour) and “bad” (lilac contour) perceived color agreement with the center. Contours of constant chromaticity differences (Δu’v’=0.001 - Δu’v’=0.007 i.e. approximations of MacAdam ellipses) measured from the chromaticity center are also shownhttps://zmi.led-professional.com/Plone/media/technology_light-generation_lps-2014-winner-article-new-binning-strategy-for-white-leds_Figure_1.jpg/viewhttps://zmi.led-professional.com/Plone/media/technology_light-generation_lps-2014-winner-article-new-binning-strategy-for-white-leds_Figure_1.jpg/@@images/image-1200-421696e858fda0c4d328f3ccbd265b07.jpeg
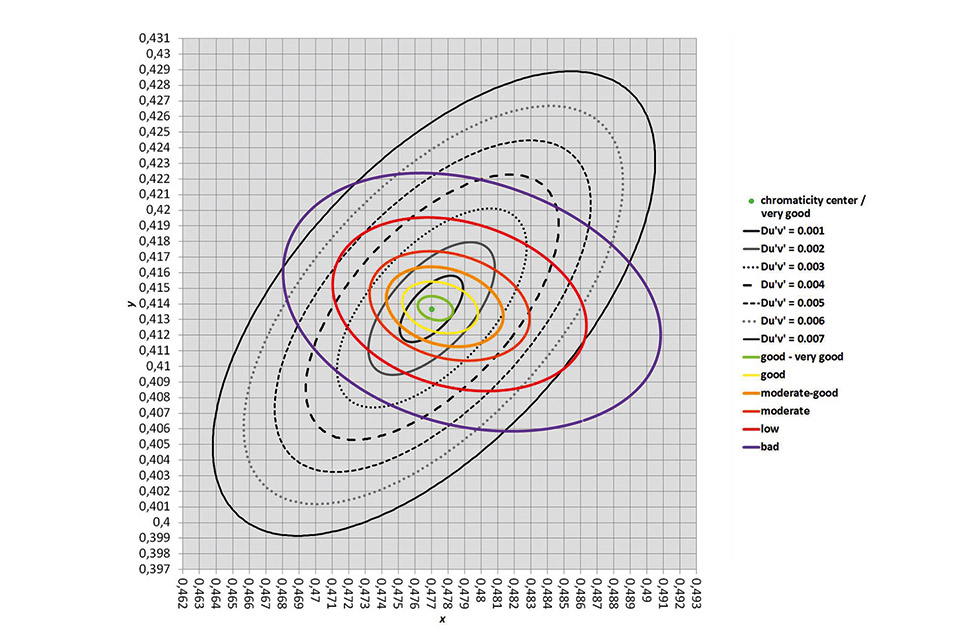
Figure 1: Semantic contours for chromaticity differences from the chromaticity center in the CIE x,y chromaticity diagram for a warm white chromaticity center, the Planckian radiator at 2500 K; x=0.4770; y=0.4137 (light green dot). Going off the center in any direction, contours indicate “good-very good” (green contour), “good” (yellow contour), “moderate-good” (orange contour), “low” (red contour) and “bad” (lilac contour) perceived color agreement with the center. Contours of constant chromaticity differences (Δu’v’=0.001 - Δu’v’=0.007 i.e. approximations of MacAdam ellipses) measured from the chromaticity center are also shown
. Going off the center in any direction, contours indicate “good-very good” (green contour), “good” (yellow contour), “moderate-good” (orange contour), “low” (red contour) and “bad” (lilac contour) perceived color agreement with the center. Contours of constant chromaticity differences (Δu’v’=0.001 - Δu’v’=0.007 i.e. approximations of MacAdam ellipses) measured from the chromaticity center are also shown")
