The Global
Information Hub for
Lighting Technologies
and Design
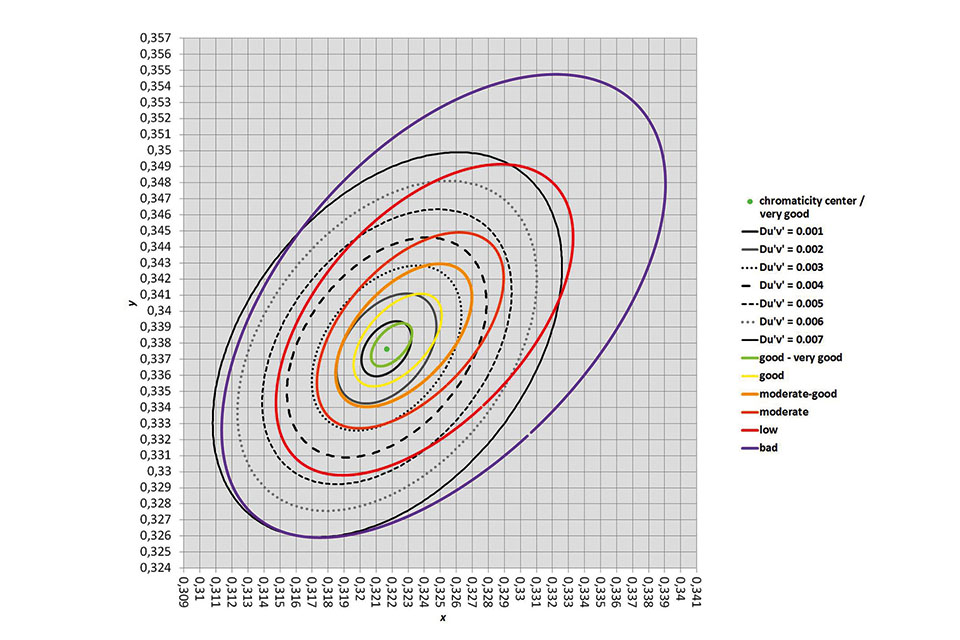
Figure 2: Semantic contours for chromaticity differences from the chromaticity center in the CIE x,y chromaticity diagram for a phase of daylight at 6000 K, x= 0.3216; y=0.3377 (light green dot). For detailed explanations, see the caption of Figure 1https://zmi.led-professional.com/Plone/media/technology_light-generation_lps-2014-winner-article-new-binning-strategy-for-white-leds_Figure_2.jpg/viewhttps://zmi.led-professional.com/Plone/media/technology_light-generation_lps-2014-winner-article-new-binning-strategy-for-white-leds_Figure_2.jpg/@@images/image-1200-421696e858fda0c4d328f3ccbd265b07.jpeg
Figure 2: Semantic contours for chromaticity differences from the chromaticity center in the CIE x,y chromaticity diagram for a phase of daylight at 6000 K, x= 0.3216; y=0.3377 (light green dot). For detailed explanations, see the caption of Figure 1
. For detailed explanations, see the caption of Figure 1")
